Understanding A/B Test Results
Results for your A/B tests can be found under Insights > A/B Test in the Studio Admin. When you get to this page, you'll see a number of columns. The data in those columns represent a variety of different things:
- Page: This is the page where the test was performed
- Test: The name of the test entered at the time of creation
- Status: This column will have one of two values:
- Active -The test is still running
- Ended - The test is not currently running (it was ended or stopped)
-
Started: The date the test began (yyyy-mm-dd)
-
Ended: The date the test finished or was stopped (yyyy-mm-dd)
-
Confidence: The percentage confidence that the winning variant is correct.
-
Variants: To understand the data in this column you need to first understand what is represented here. Put shortly, this column gives an in-depth look at the performances of both 'versions' of the component you're testing.
In the below example, the line highlighted in yellow is the Variant (the 'changed version' of the component you're testing), and the line highlighted in Purple is the Control (the 'original version' of the component you're testing).
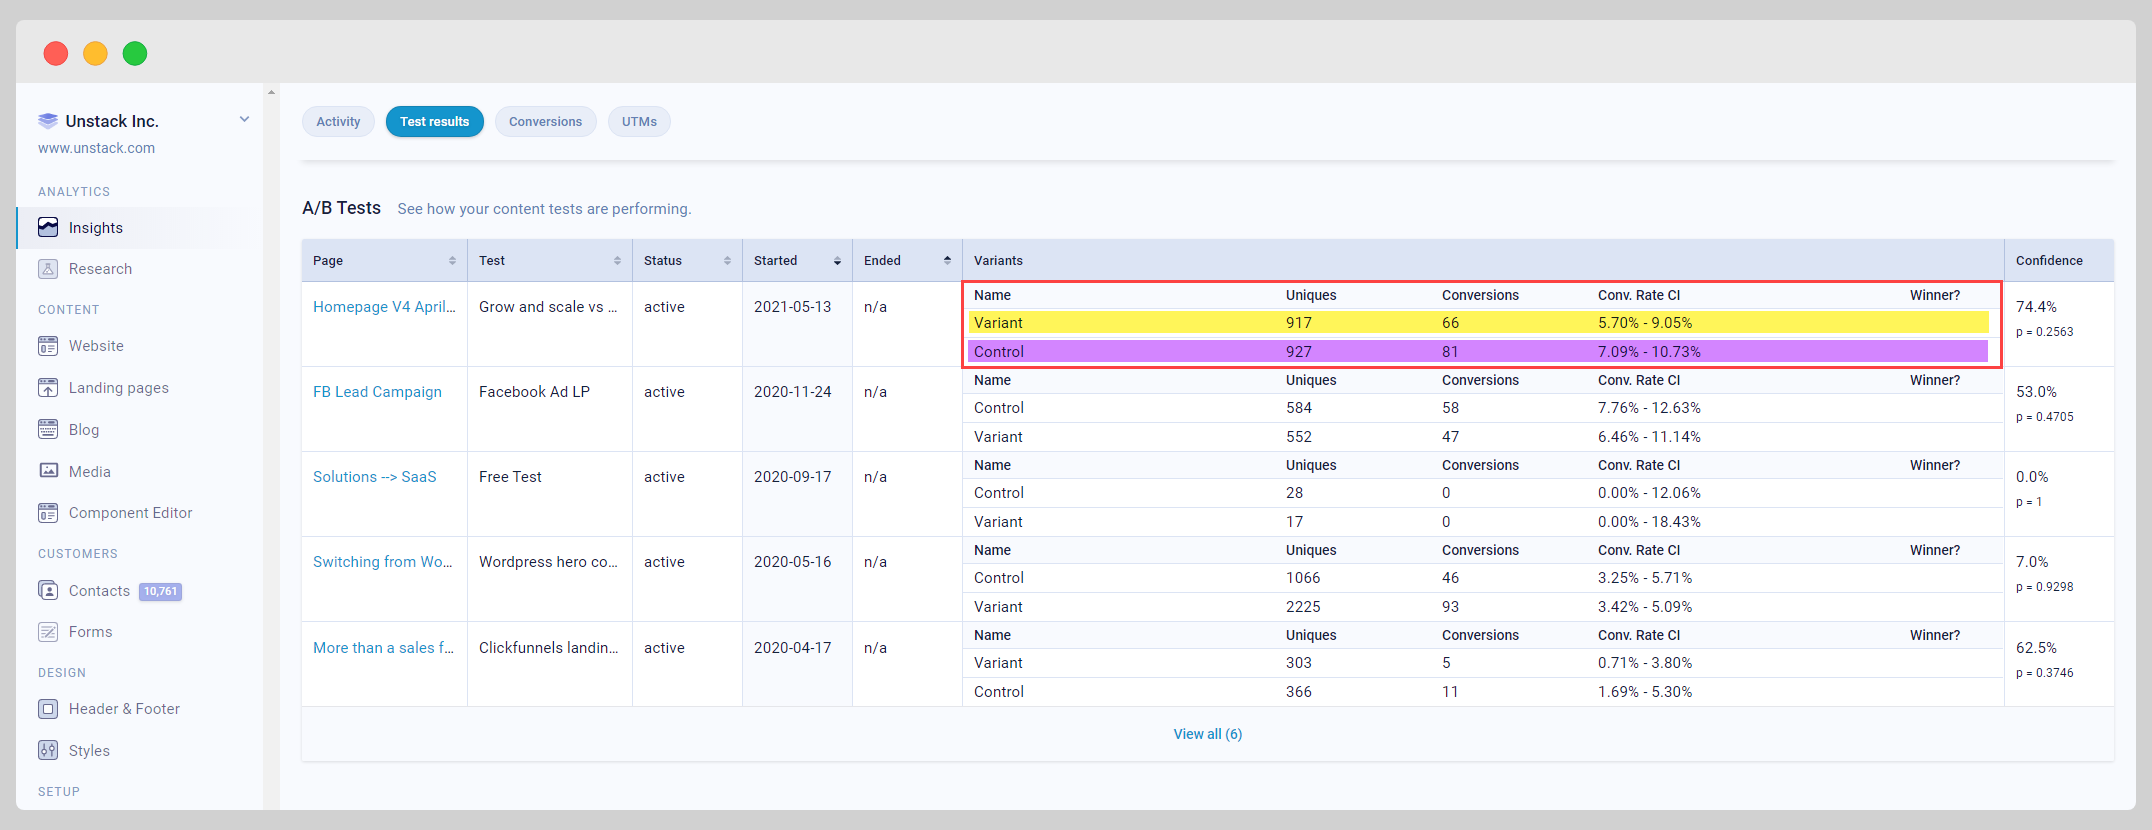
Below are the definitions of some additional metrics mentioned in that column:
- Uniques - How many unique views each variant has received.
- Conversions - How many times the defined goal was completed for each variant.
- Conversion Rate - The number of unique users divided by the total number of conversions for that variant. This may be a range if data volatility is high for your test.
- Winner - The winner of the test who was either manually chosen when the test was ended by a user, or was automatically determined when either the Variant or the Control reached a confidence percentage that exceeded the pre-defined Result Certainty of the test.
How do we calculate A/B test results?
We use the Pearson Chi-Squared test for calculation of A/B test results. The p-value is the inverse of the confidence in the results. E.g. a p-value of 0.05 means 95% confidence (i.e. 1 out of 20 such tests would yield a false positive). You can set the target p-value lower if you want more stringent test results, although .05 is generally considered acceptable in the world of marketing for all but the largest scale tests.
You'll sometimes see ranges listed for Conversion Rate because of how the Chi-Squared test actually works.
In other words, if there were 10 clicks and 100 unique visitors, then that is obviously a conversion rate of 10%. However, the Chi-Squared test result would imply that based on the amount of data collected, the implied volatility is still high, and therefore shows a range since expecting a final result in the range of (as an example) 5.0% to 10.0% is reasonable.
Chi-Squared test results will not yield a winner until the ranges on both segments narrow with more data so as not to produce an overlap between them exceeding the target p-value.