Interpreting Insights
Overview
"Insights" is what we call the section in Studio where you can review the various metrics & data-points collected on your site. There are also four tabulated sections for further insights: Activity, Test Results, Conversions, and UTMs.
Traffic
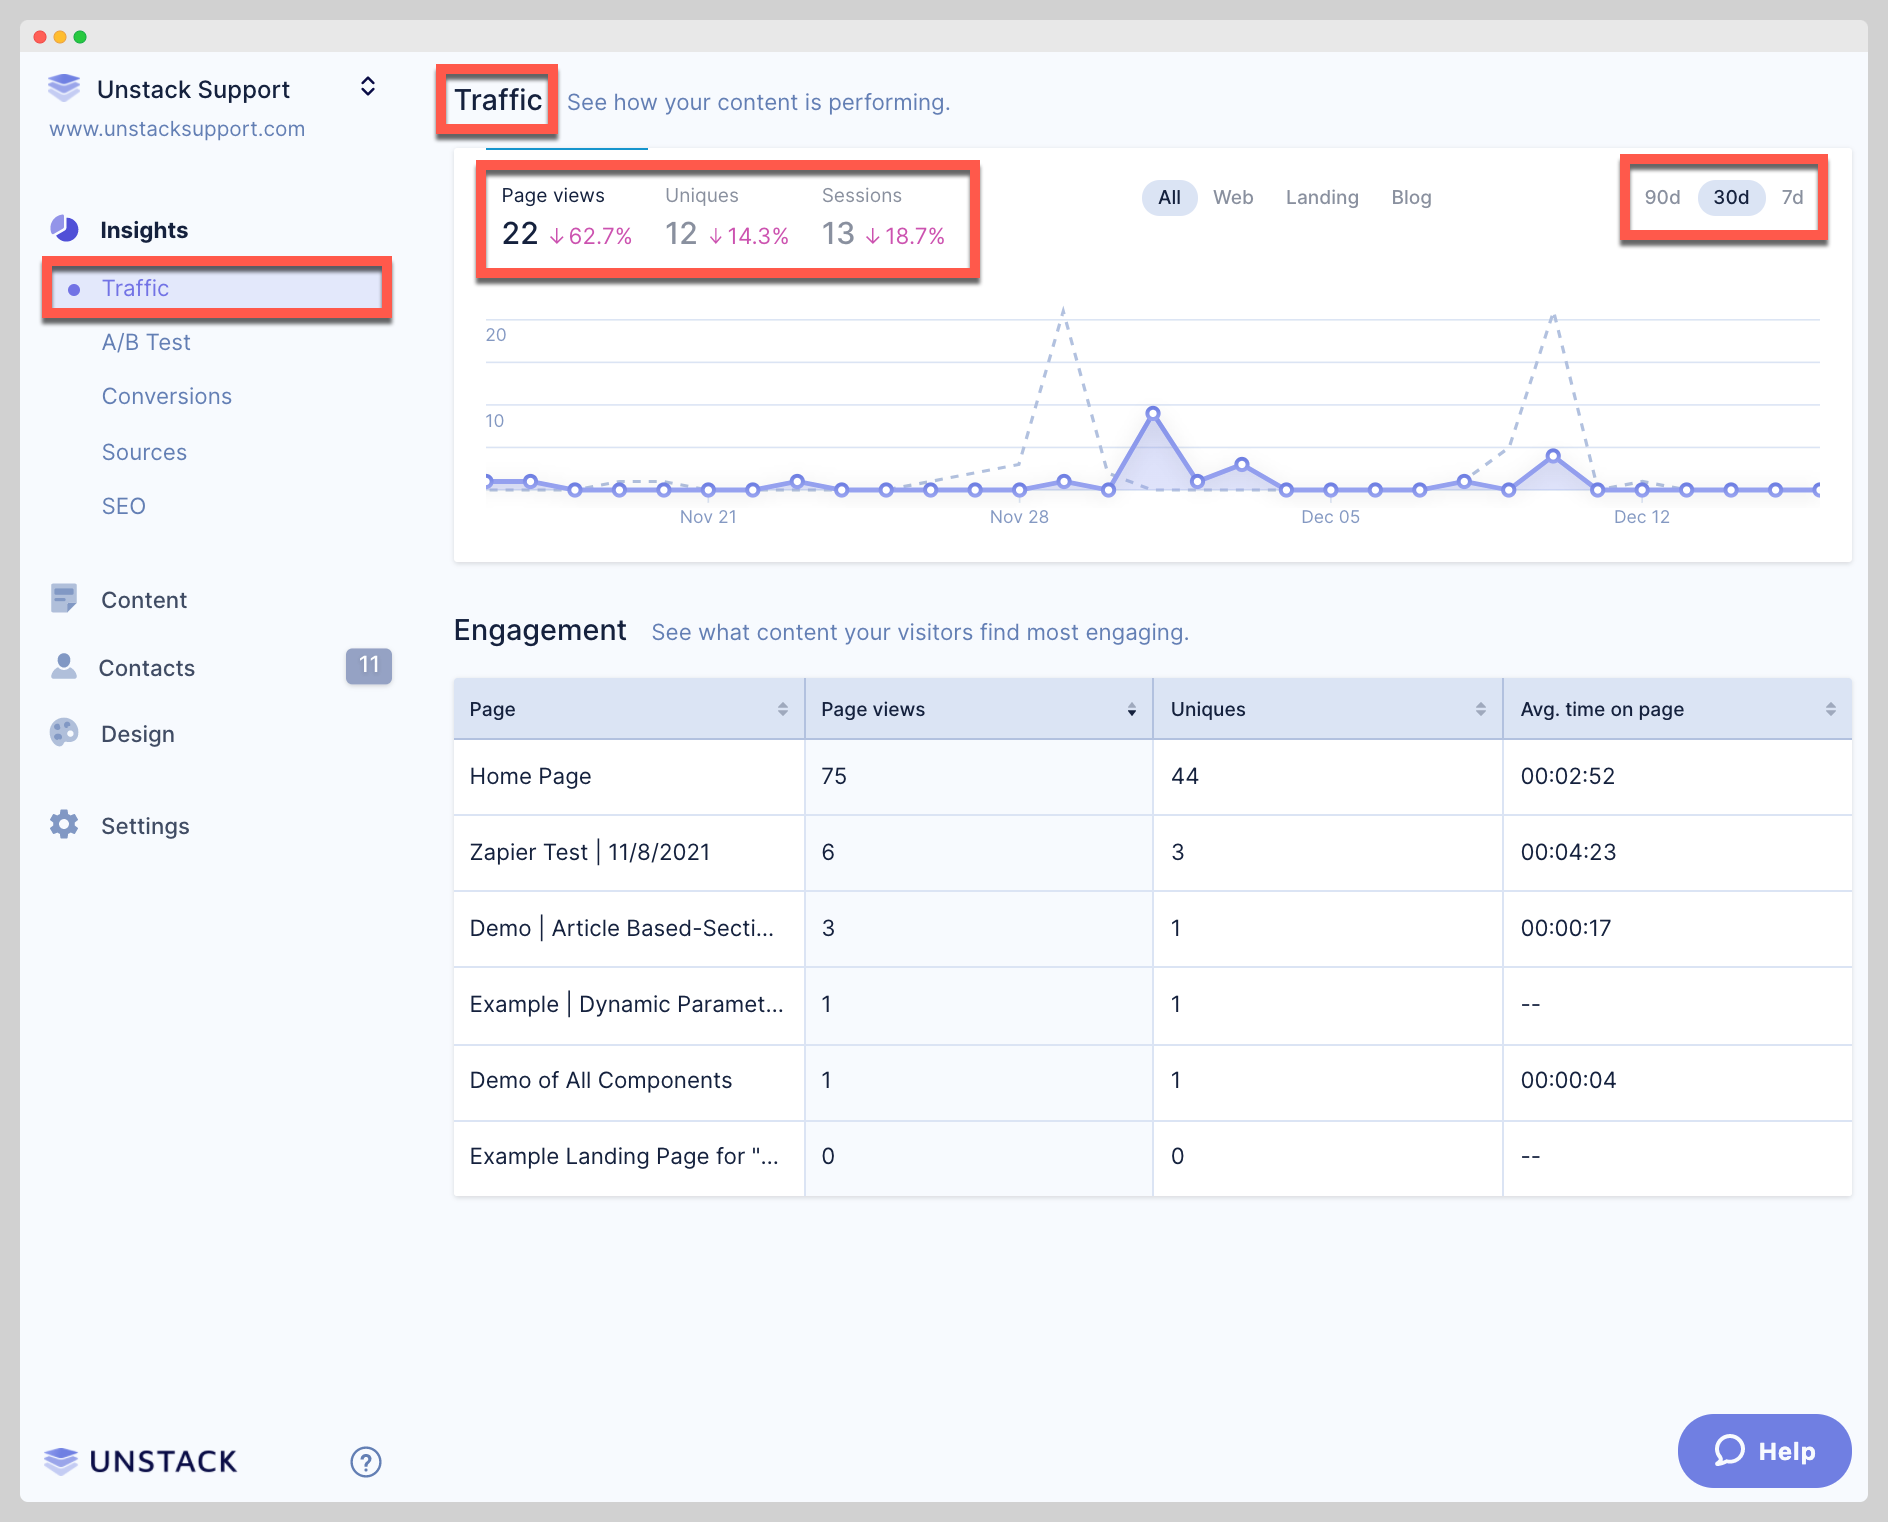
This is made up of two sections: Traffic which will provide an overview of how your site is doing and Engagement which will show you how your pages are performing.
The graph depicting site performance is broken down by three specific metrics: Page Views, Uniques, and Sessions.
-
Page Views: Times a page is viewed by a user.
-
Uniques: Number of unique users.
-
Sessions: Interactions one user takes within 4-hour time frame.
You can toggle through 90-days, 30-days, and 7-days to see how your traffic has changed over time.
-
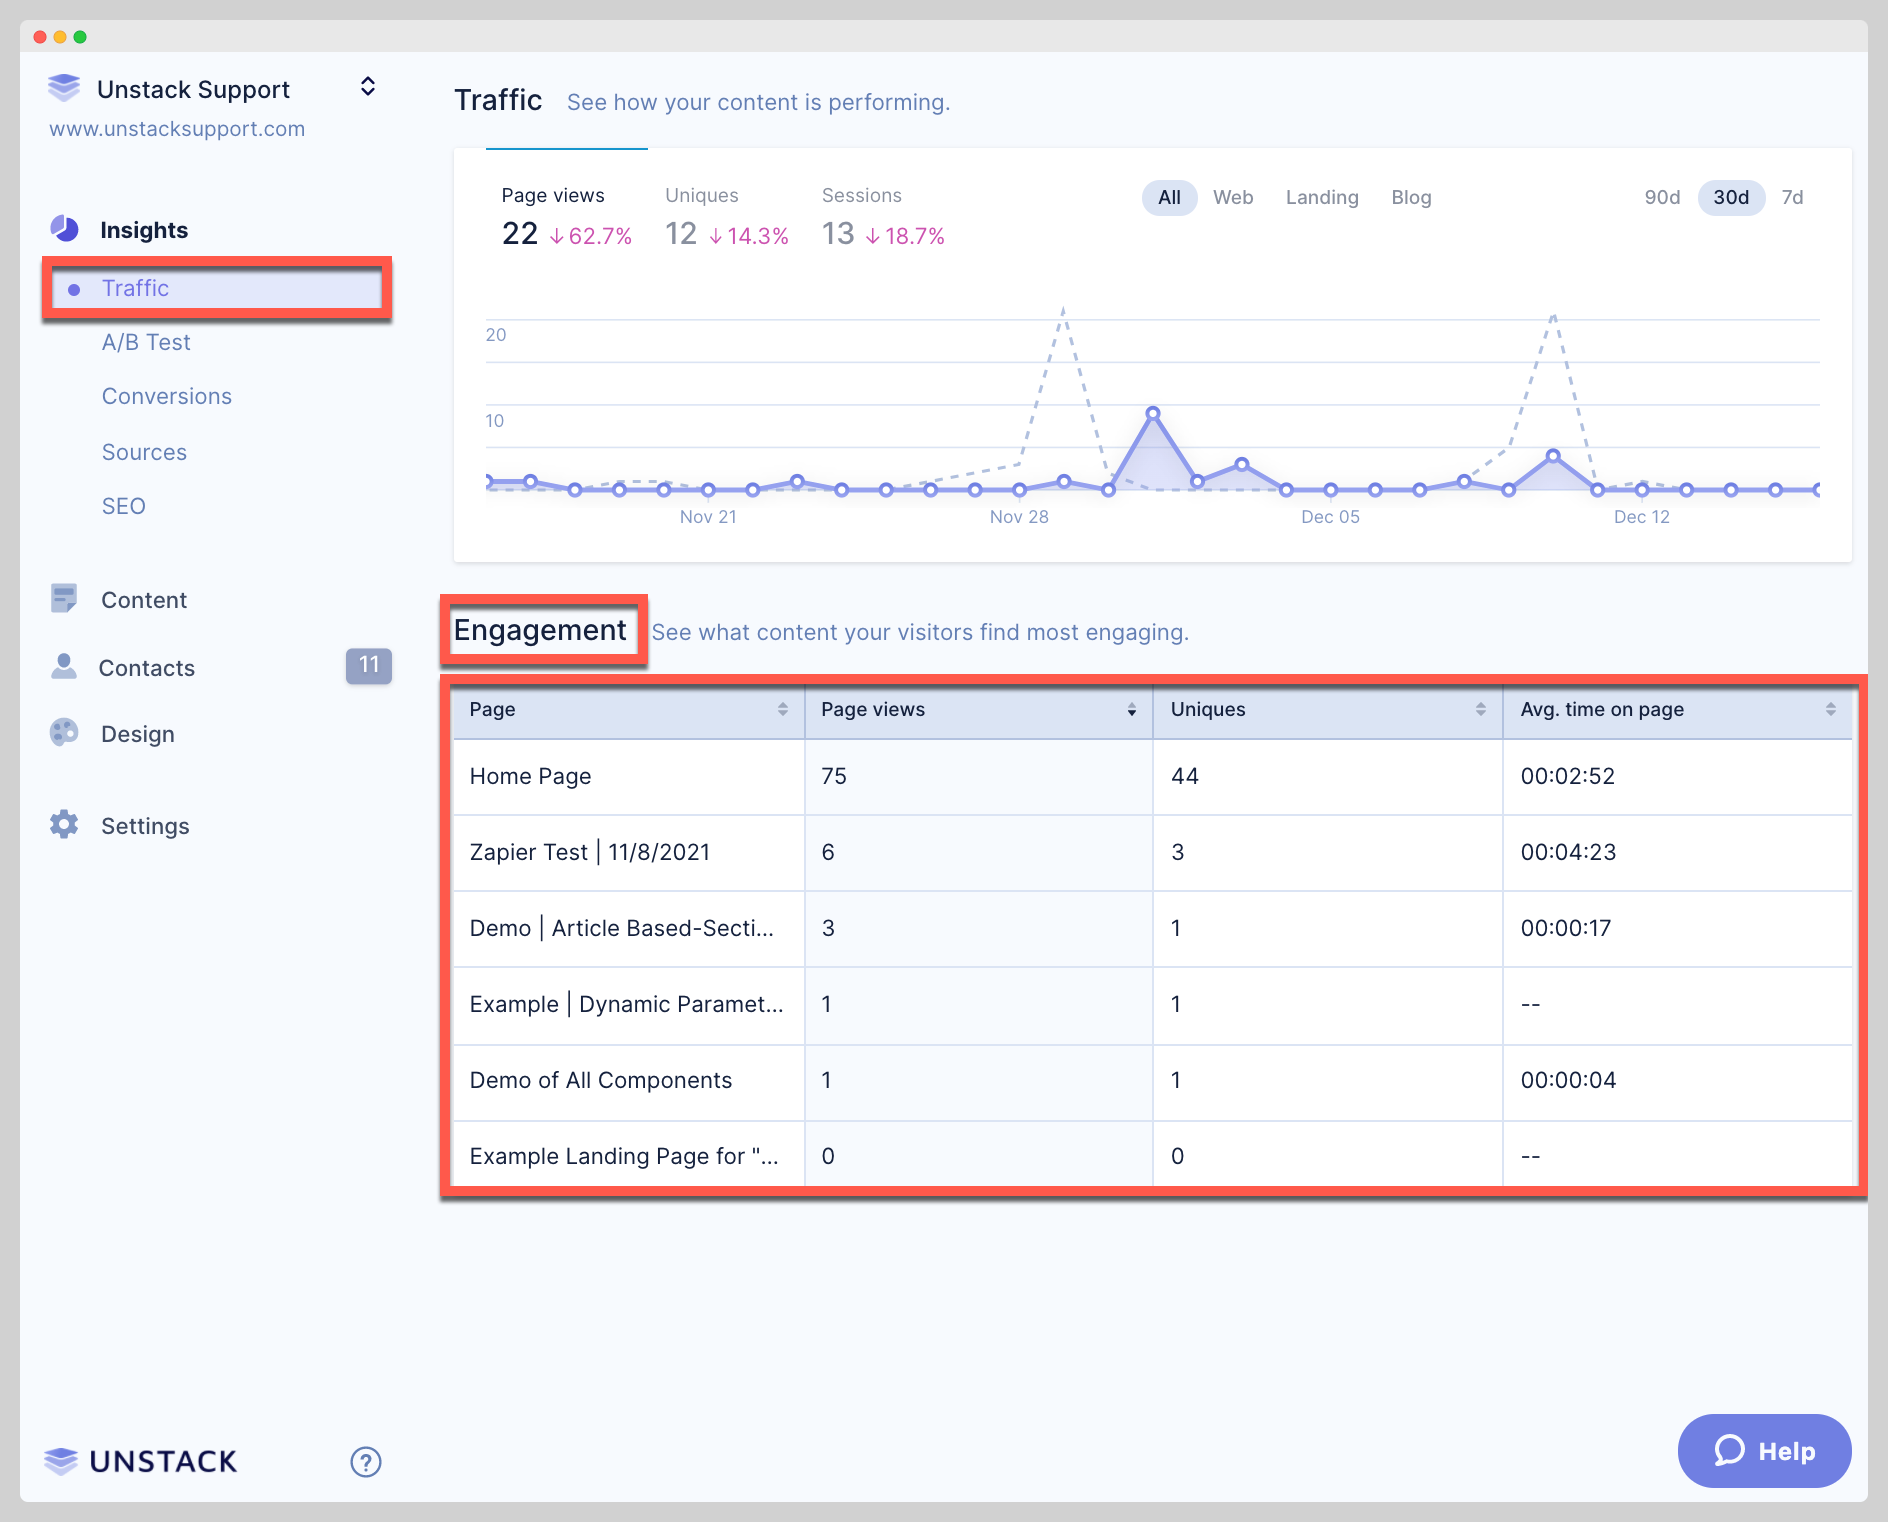
Engagement: A list of all your pages, their view count, unique, and average time on page.
-
Page: Title of page.
-
Page Views: Times the page is loaded and viewed by a user.
-
Uniques: Number of different IPs that visited a page.
-
Average time on page: Average time a user spent on this page.
Below is an example of sorting by descending and ascending for different data points.
-
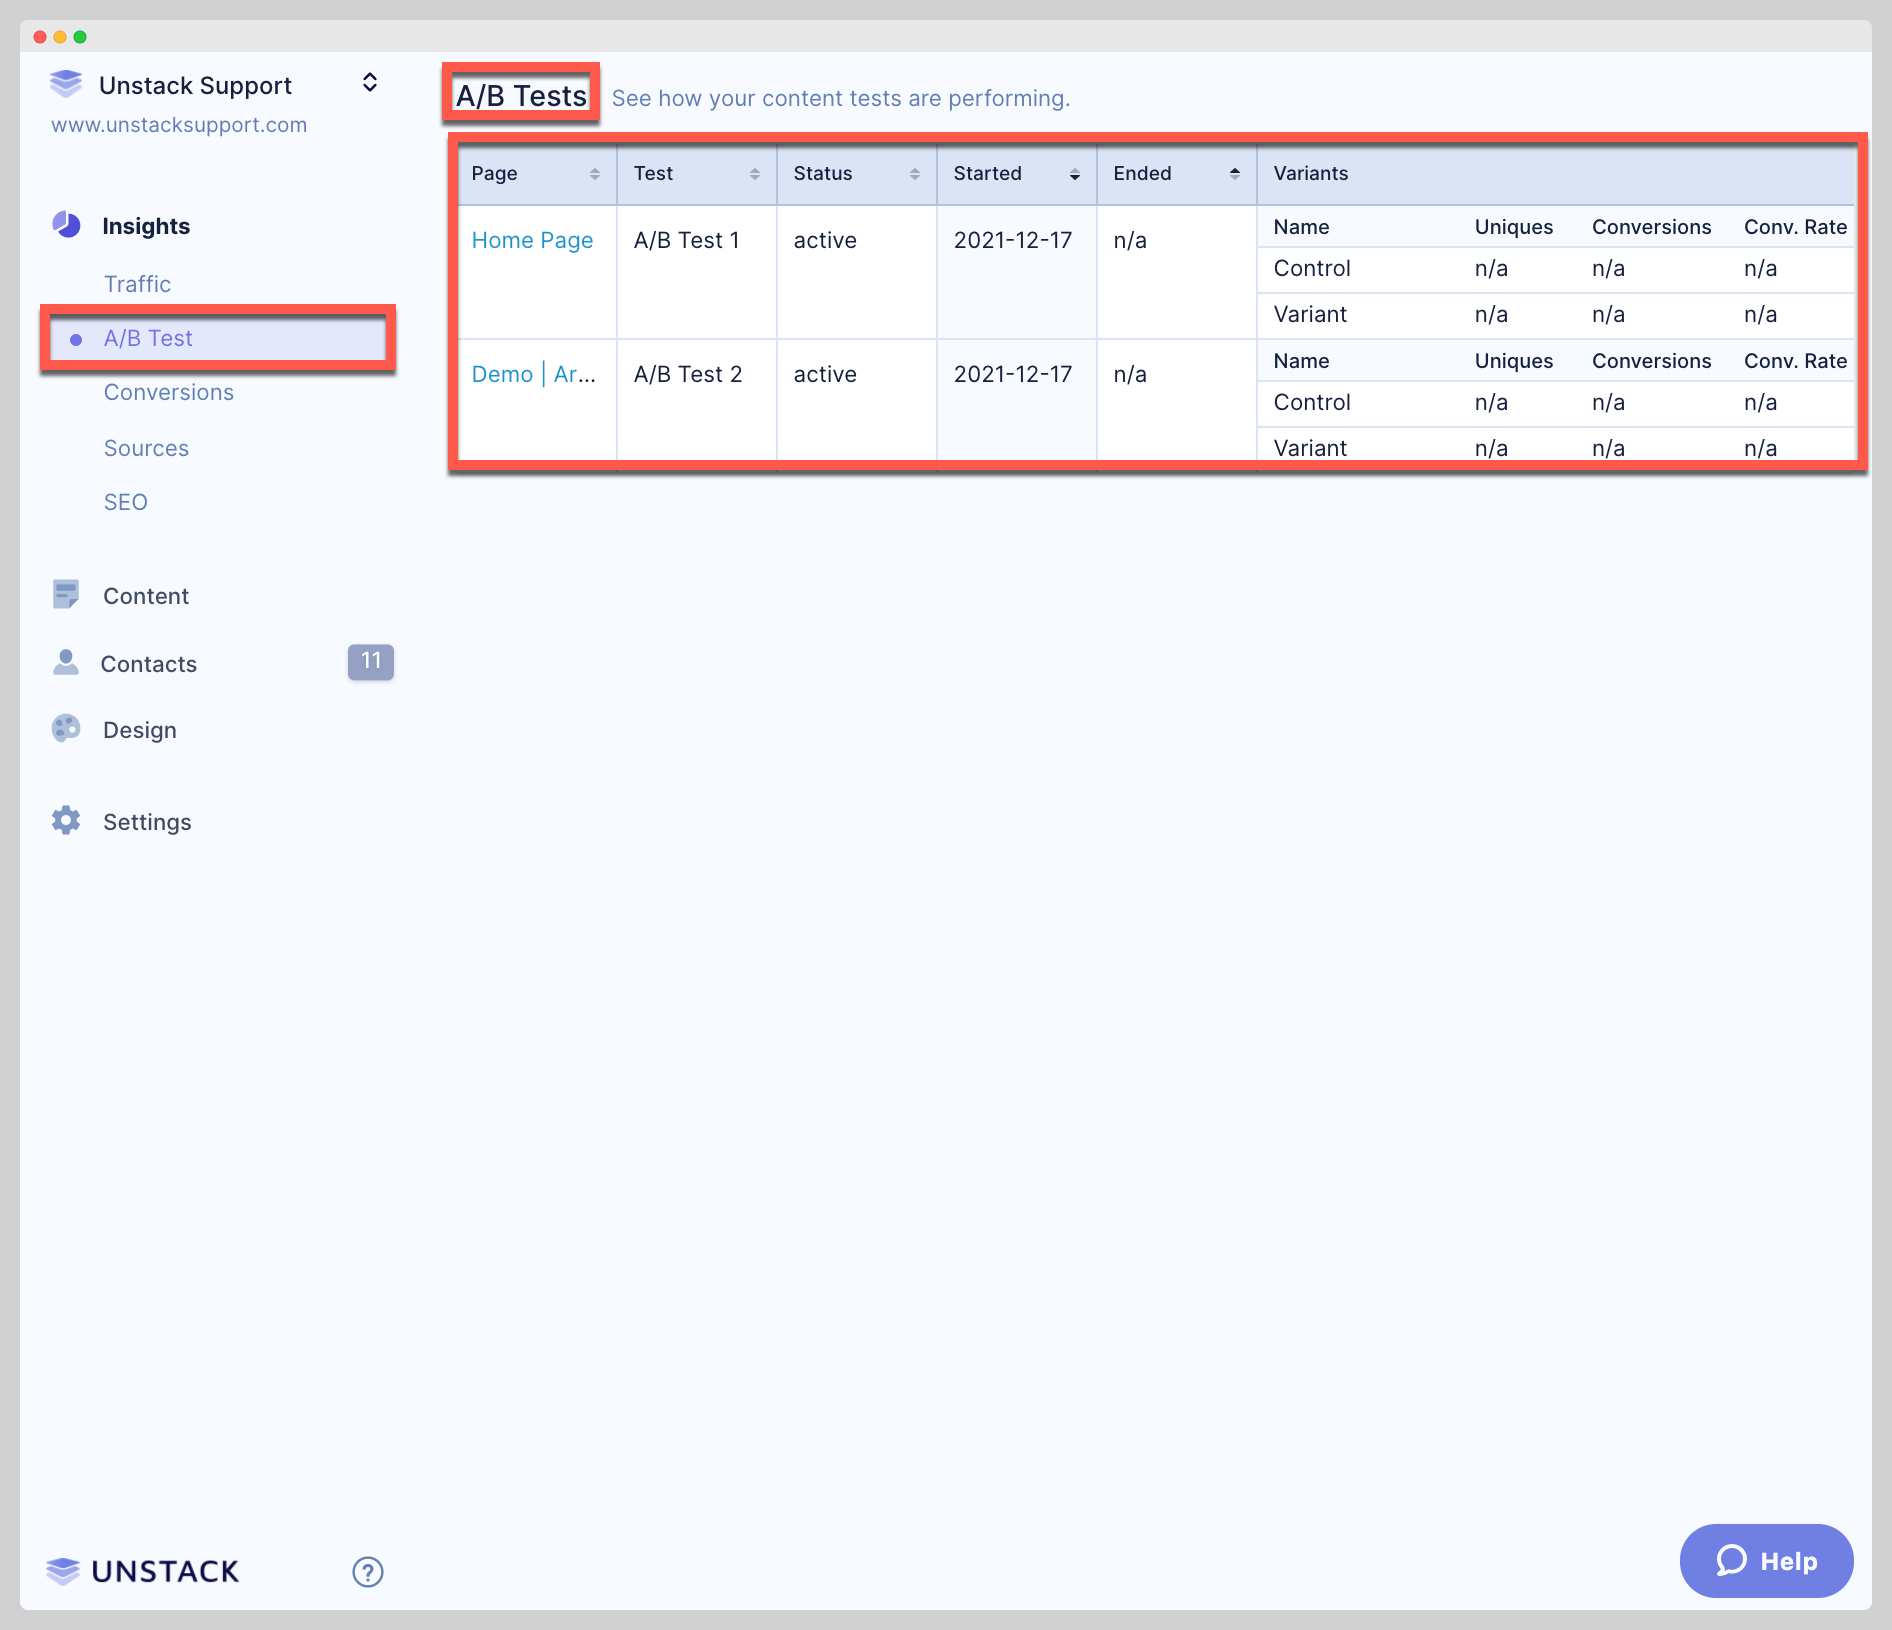
A/B Test: An overview of your A/B tests, where they were done, how they're doing, and what the end result was.
-
Page: Hyperlinked name of the page test is running on.
-
Test: Name of the test assigned when setting it up.
-
Status: Whether the test is active (running) or ended (concluded).
-
Started: Date this test began.
-
Ended: Date the test ended.
-
Variants: In-depth view into different variants of test and they're performance.
Variants
- Name: Which variant this is: control (unedited) or variant (edited).
- Uniques: How many visitors viewed this variant.
- Conversions: Times visitors have submitted a form from this variant.
- Conversion Rate: Conversions divided by Uniques to see the percent of visitors who convert.
- Winner: Whether or not this was the winning variant.
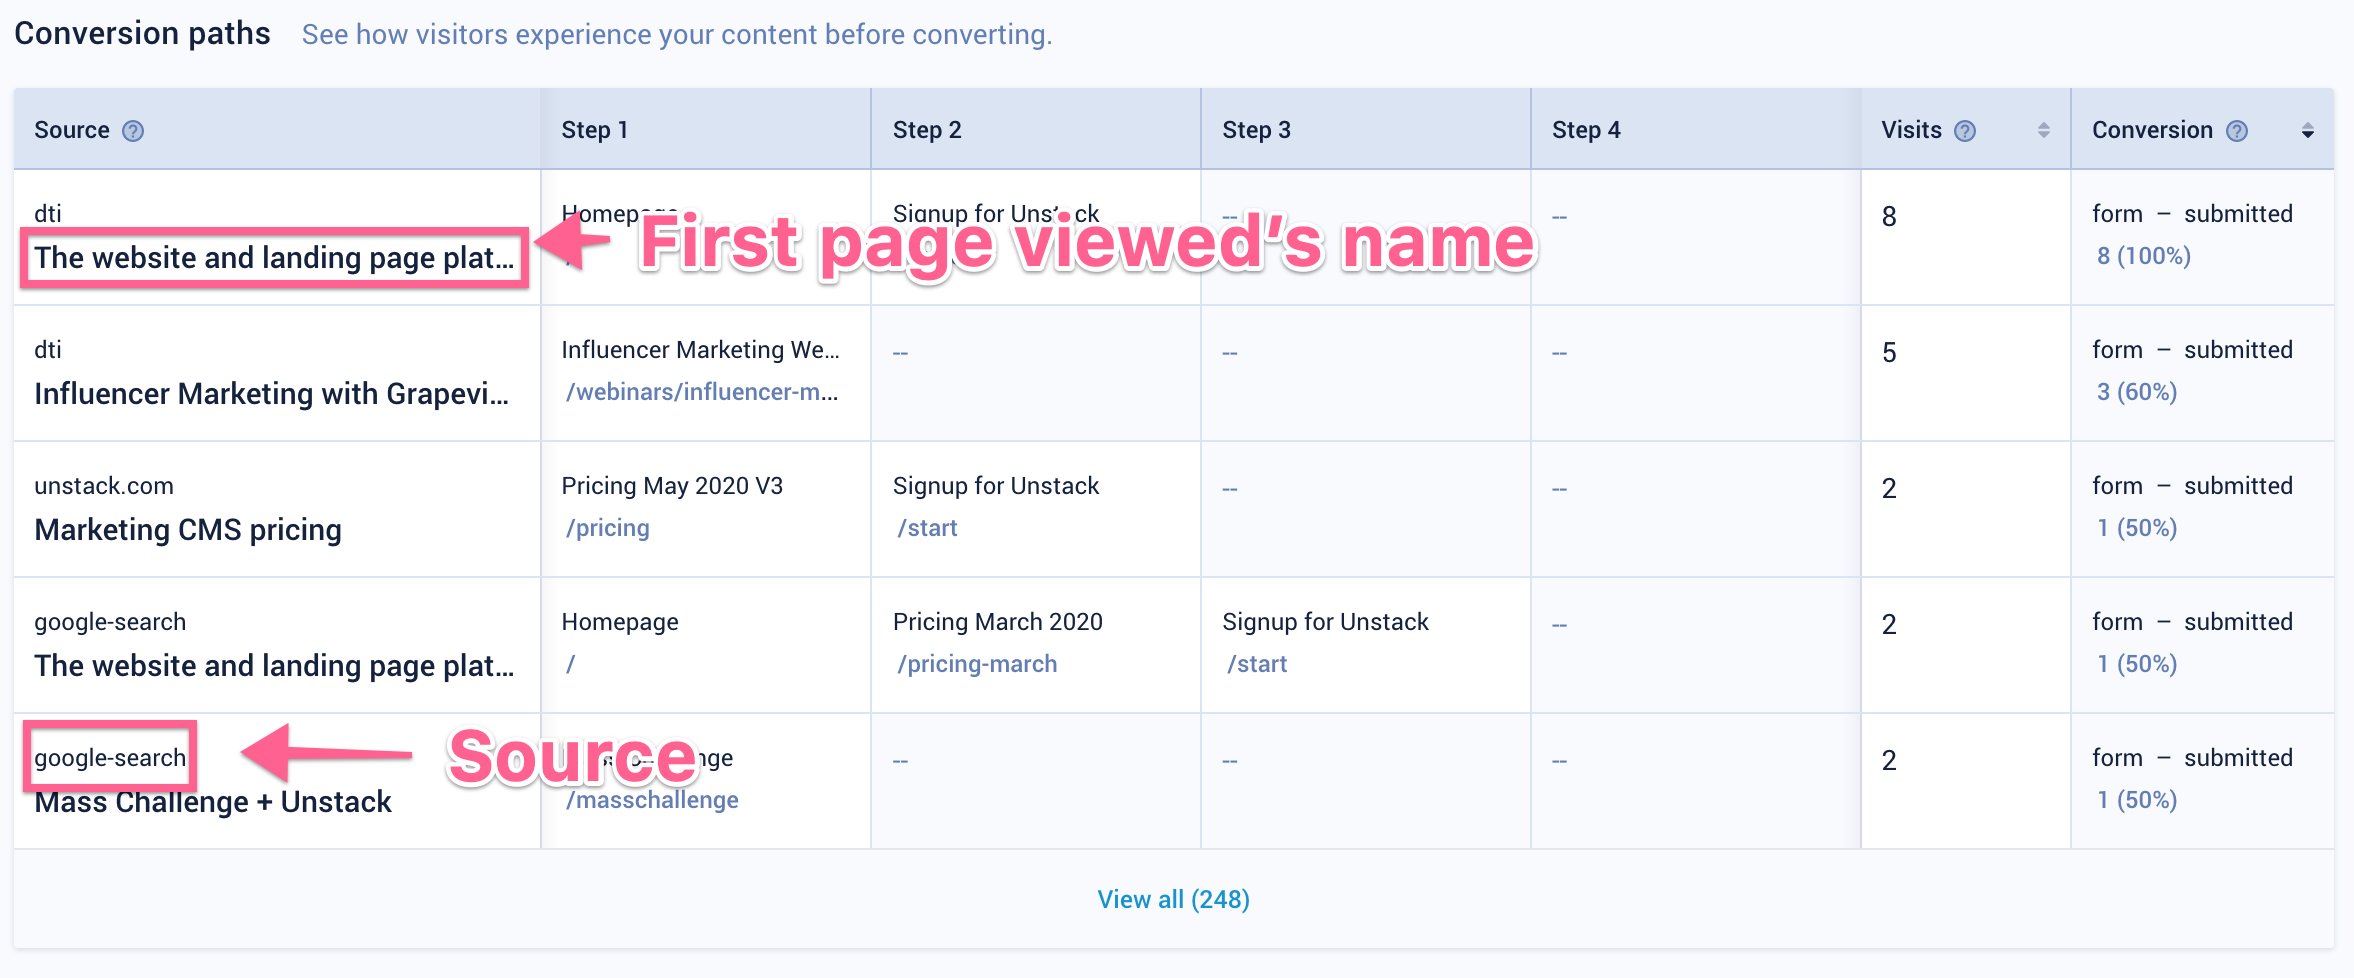
Conversions
A representation of the path your visitors go on before converting.
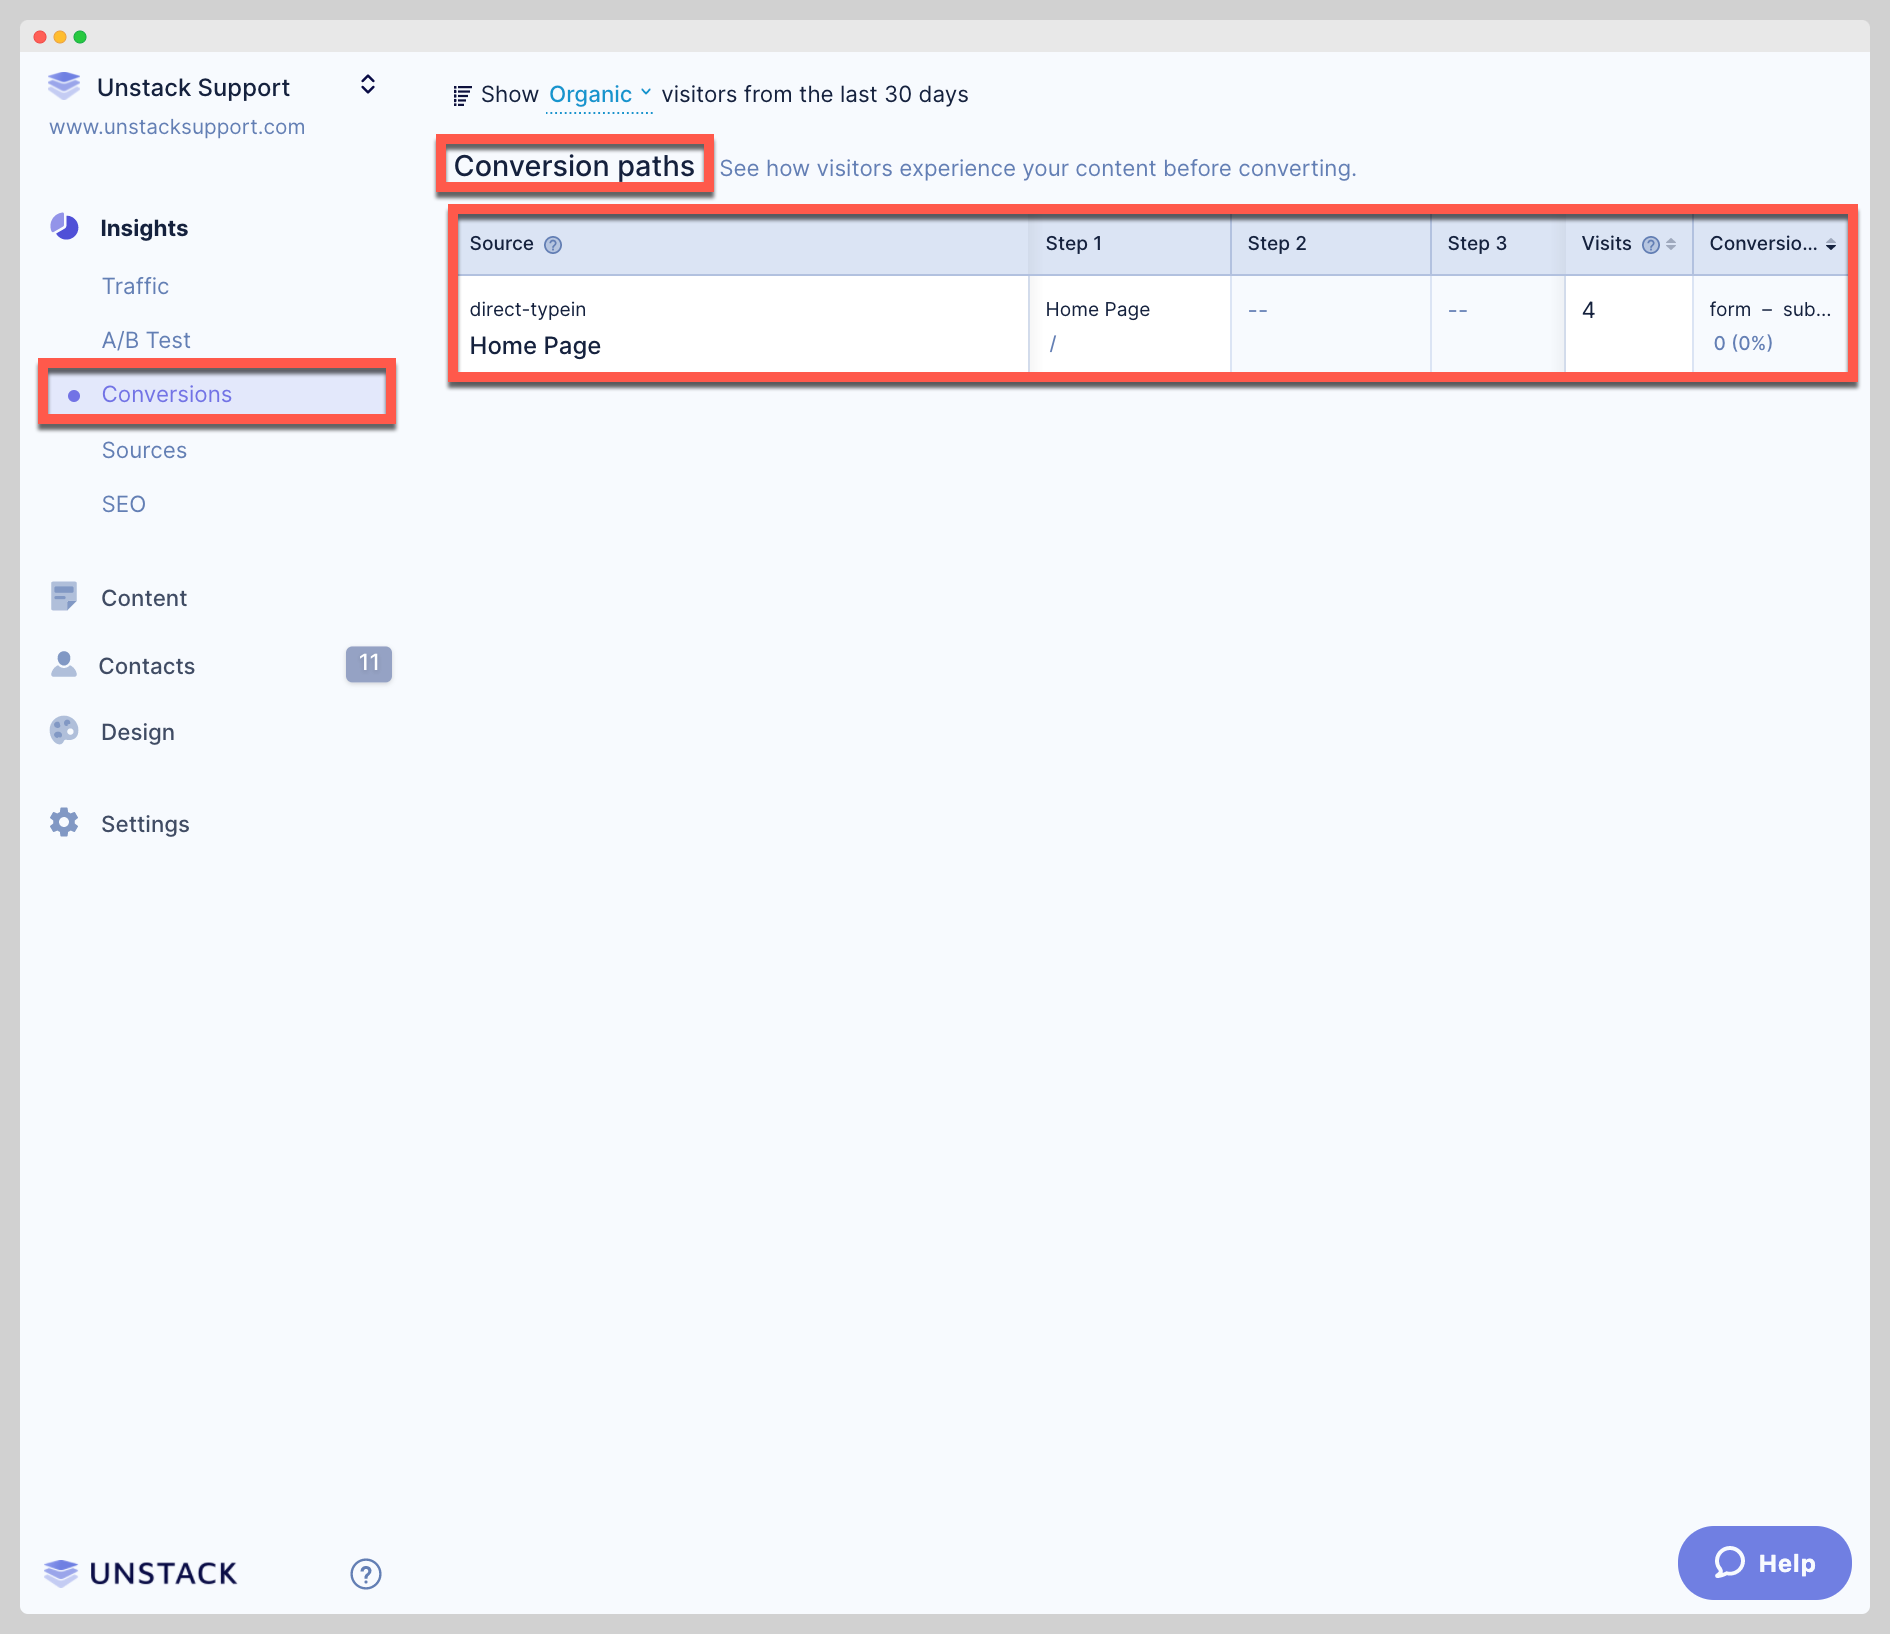
See screenshots below for examples:
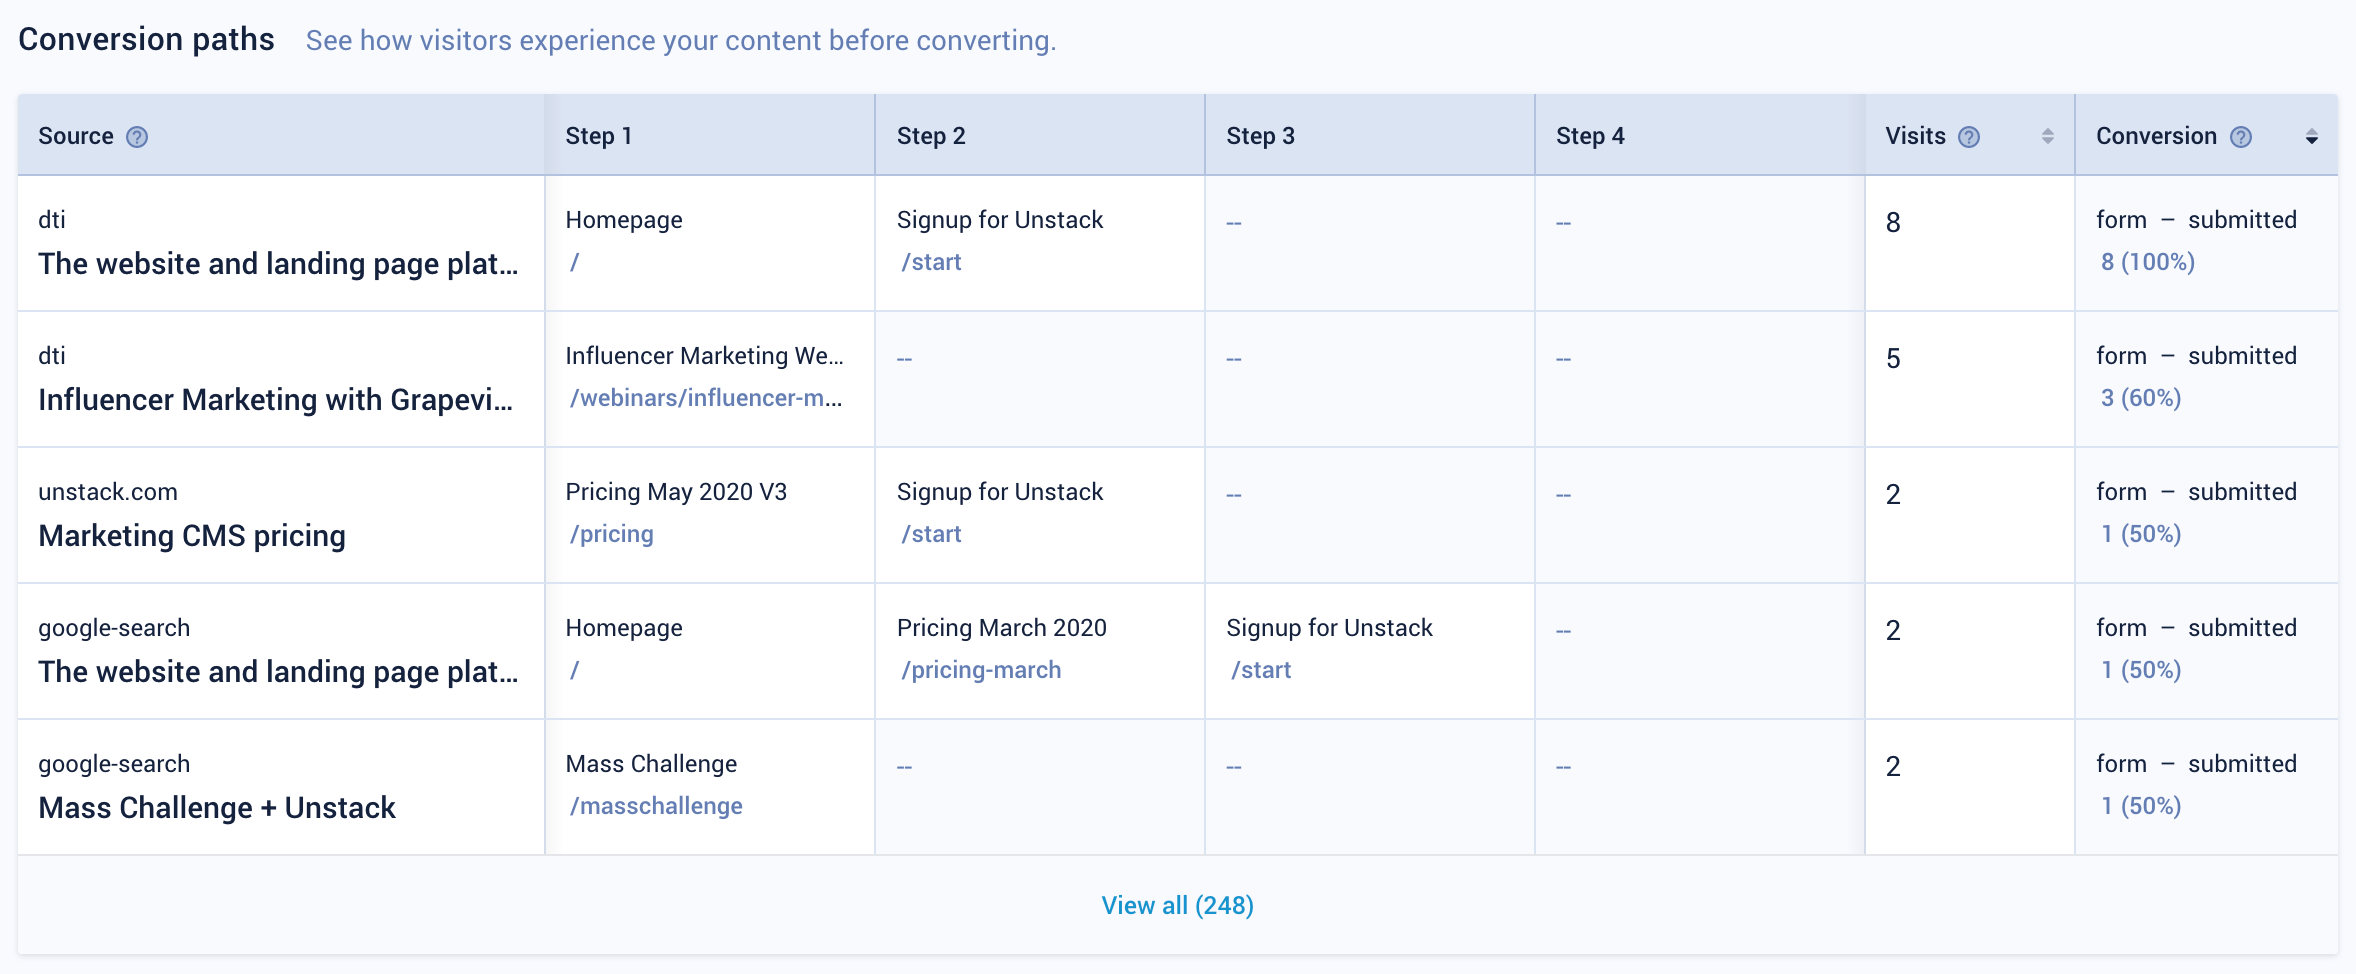
This is going over the source someone came from and the pages they viewed before converting via a form submission.
Like engagement, you can toggle to sort visits and conversions numbers.
New from conversion paths you can toggle between conversion paths for organic traffic and paid.
Sources
An overview of where your site traffic is coming from and the revenue/lead attribution as provided by Studio CRM and Stripe integration.
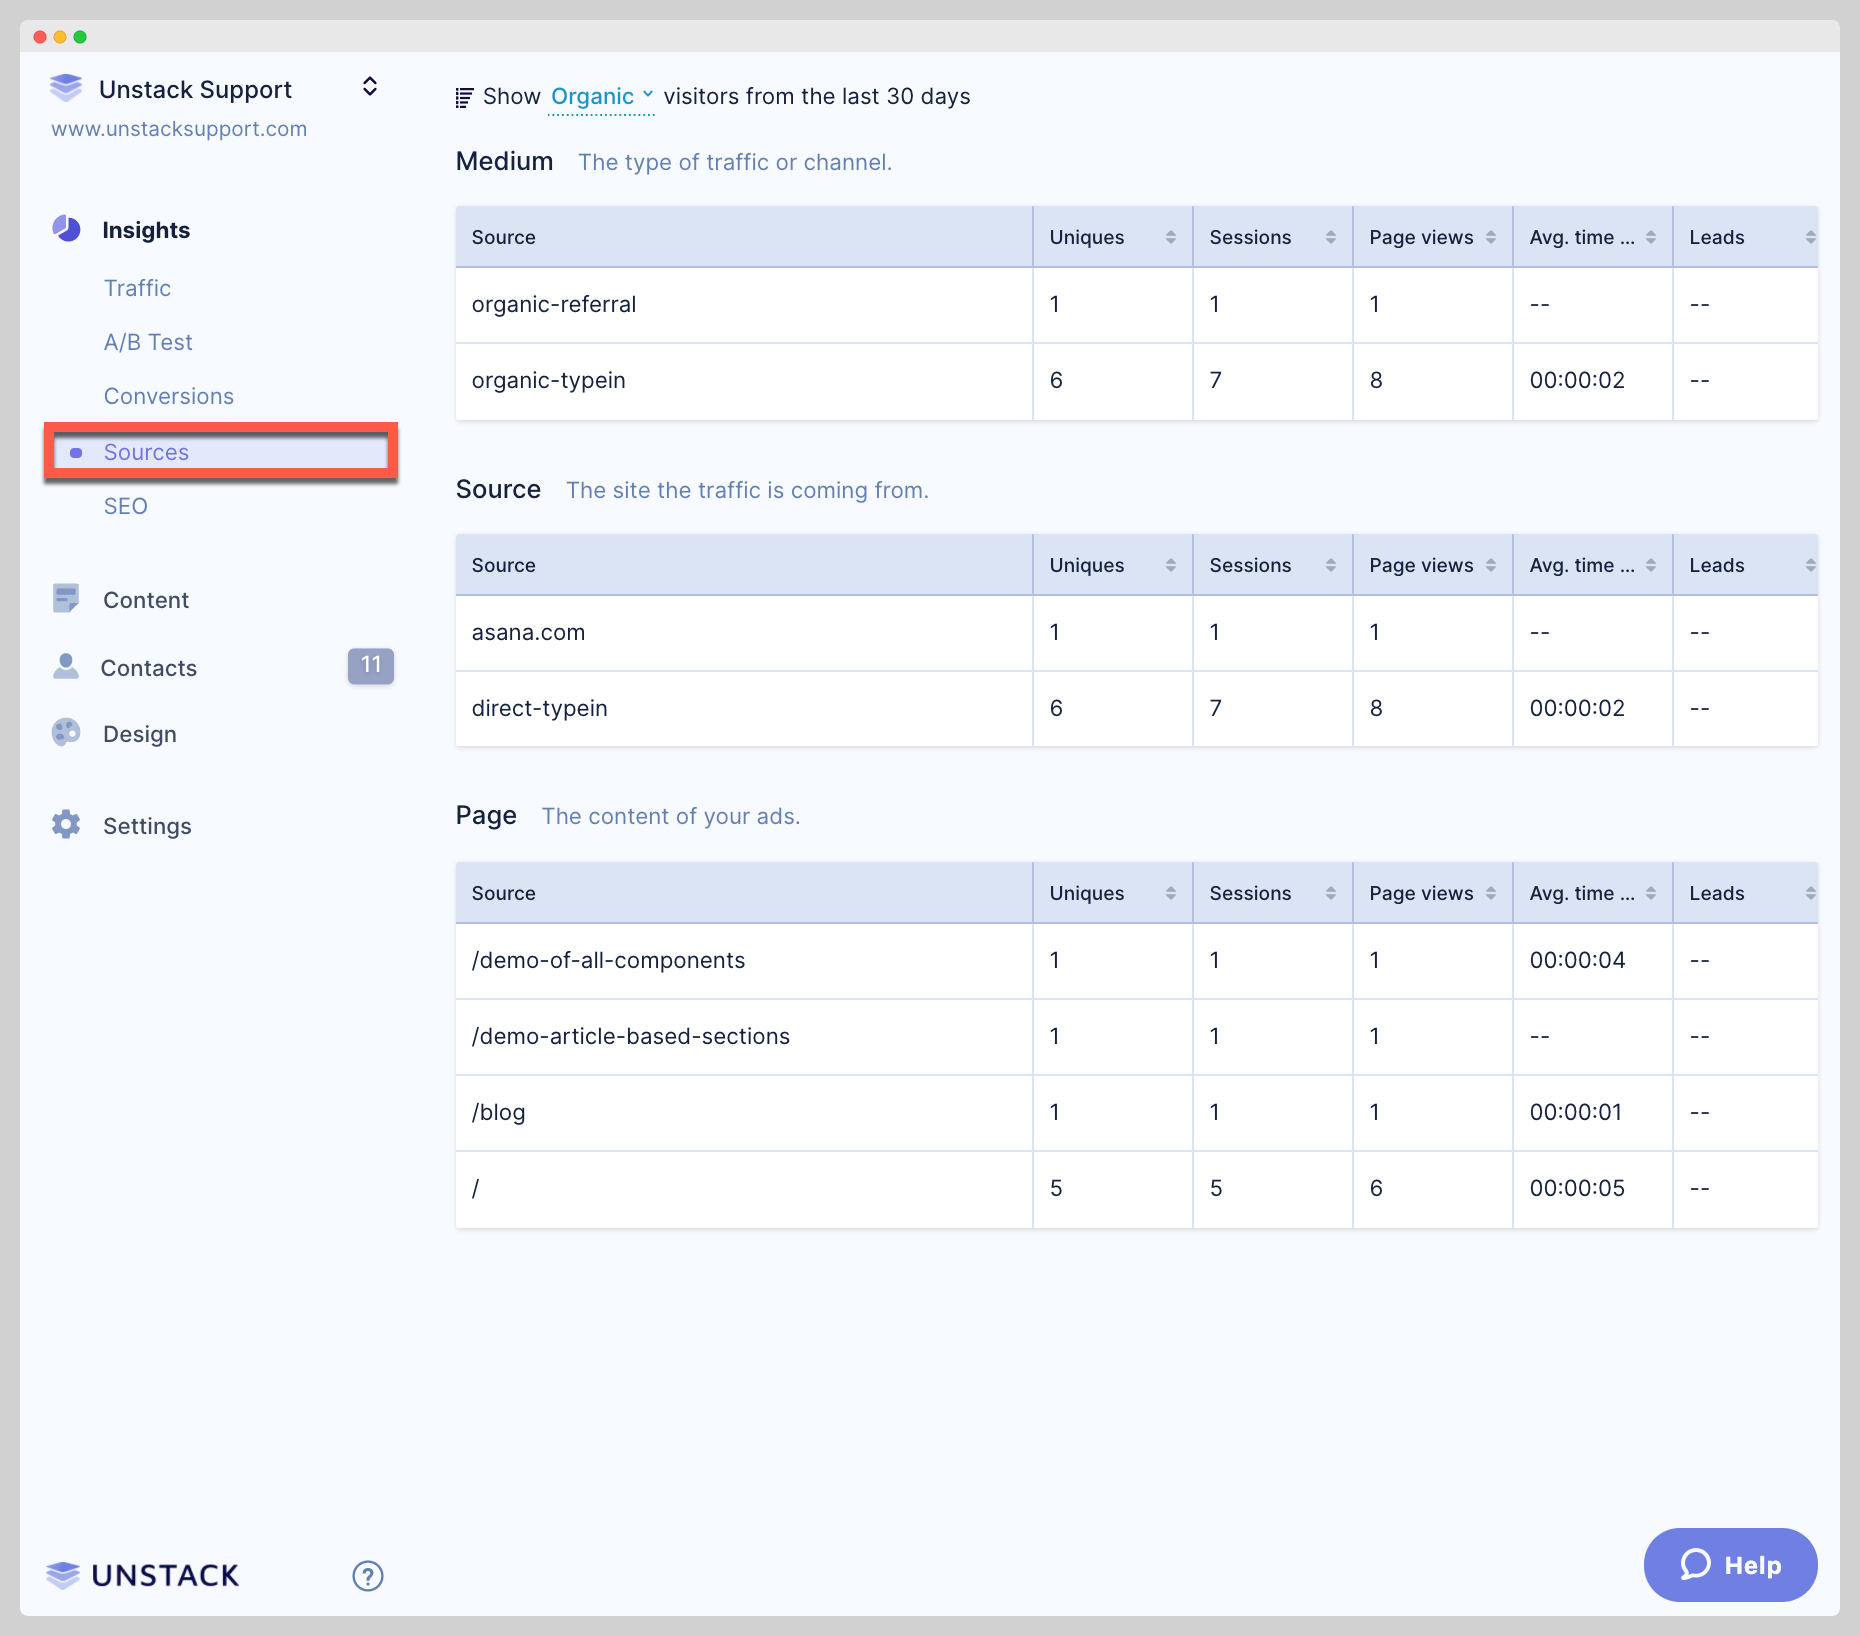
This is the same for all other units (i.e., source and page)
- Source: Where the traffic came from.
- Uniques: Number of unique users from that source.
- Sessions: How many sessions source produced.
- Pageviews: How many page views source produced.
- Avg. time: Average amount of time a user from that source spent on the page
- Leads: Attributed leads from that source (click view to see them).
- Conversion rate: Percentage of users who converted via a form.
- Bounce rate: Percentage of users that leave without converting.
- Revenue: Amount that source has generated (from Stripe integration).
- Rev/click: Total revenue divided by the number of Uniques.