Overview
Monitor provides an aggregated view of all of your integration activities with visibility into each execution and the ability to drill into the details of any execution. Filter the logs or executions screens to look for failures across all integrations or filter down to a specific integration or even a specific process flow within a specific integration. Monitor acts as an operational control panel for your business, providing your DevOps teams with one central environment through which to view and manage your federated architectures to alert you via Slack or Email that an integration that runs daily ran successfully.
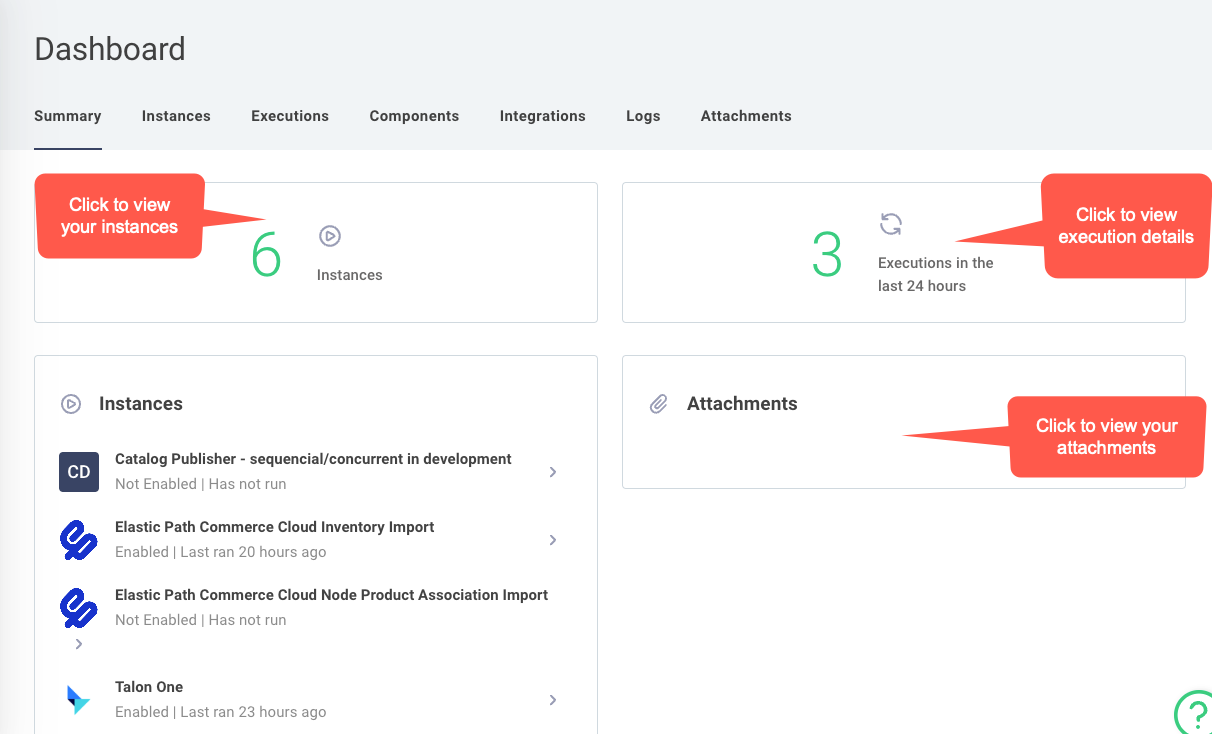
In Summary, you can see the total number of instances you have, including a list of the running instances. Either select an individual instance or select the pane to go to Instances.
In addition, you can see the total number of executions in the last 24 hours. Select the pane to view the details of the executions.
Finally, you can view any attachments you have.