Logs
Monitor allows you to view groups of logs for all the integrations that you have turned on in Composer. Access to logs is critical for building, deploying, and supporting your integrations.
Log Retention
Logs and step results are retained for 14 days and are purged thereafter.
Viewing Logs for Integrations
To see logs for all your instances:
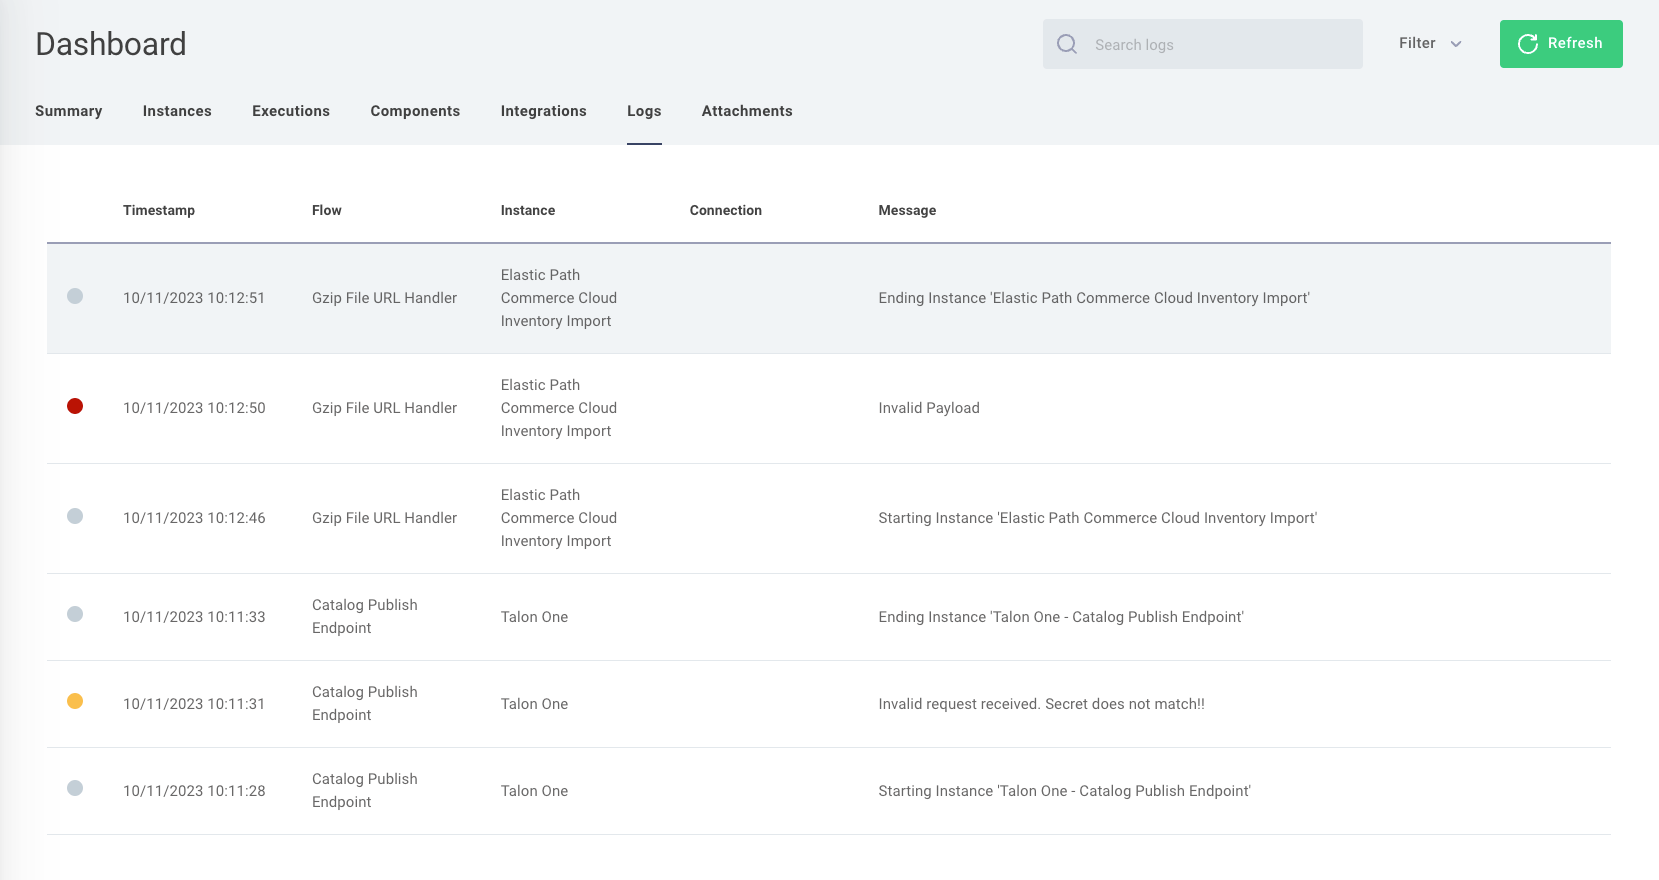
- Go to Composer > Monitor.
- Select Logs. You see log messages, their timestamps in your local time, the name of the instance and the name of the integration the instance was created from.
-
To see a log's details, select the log you want for the instance you are interested in.
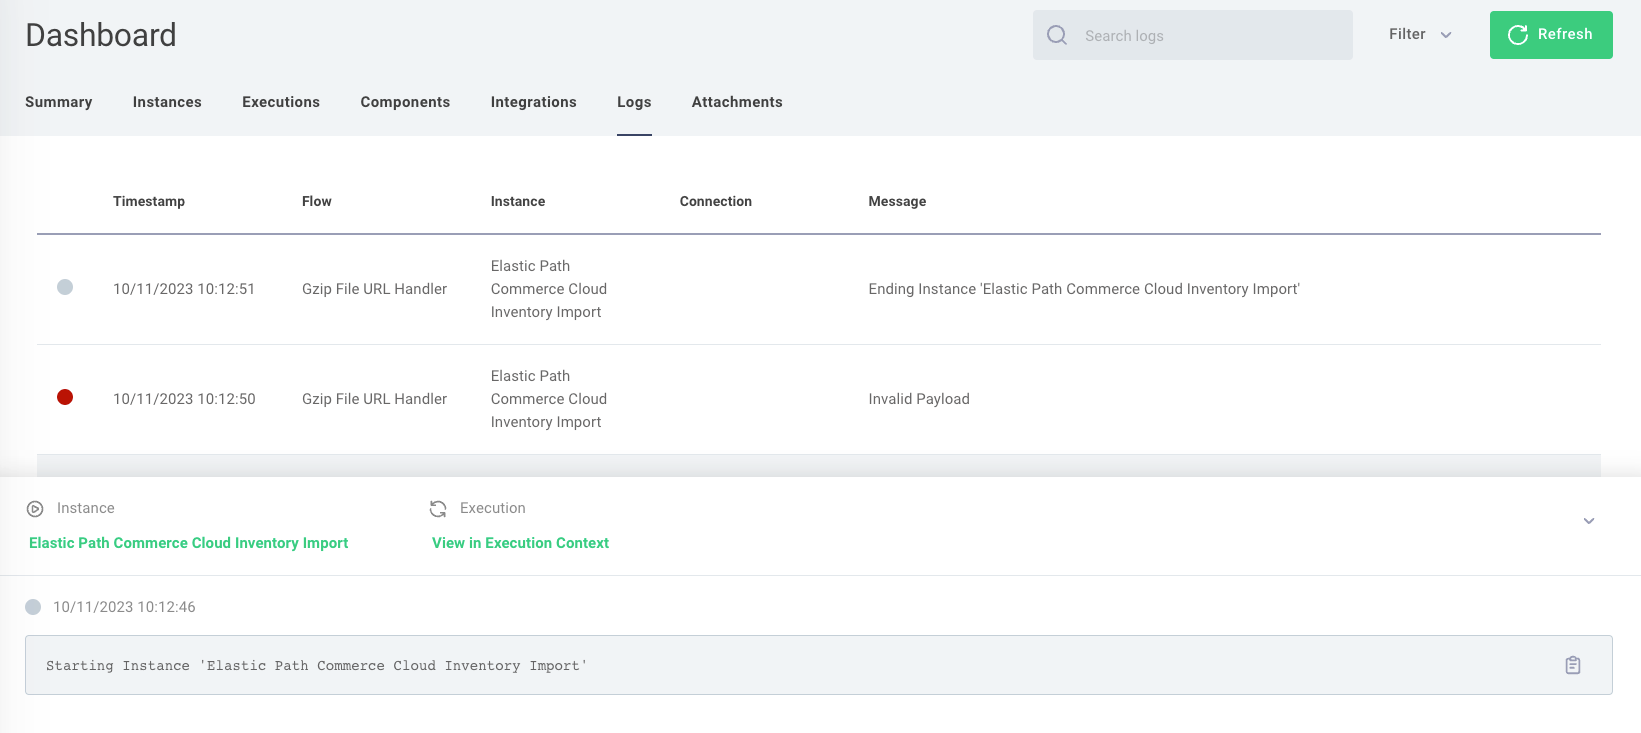
-
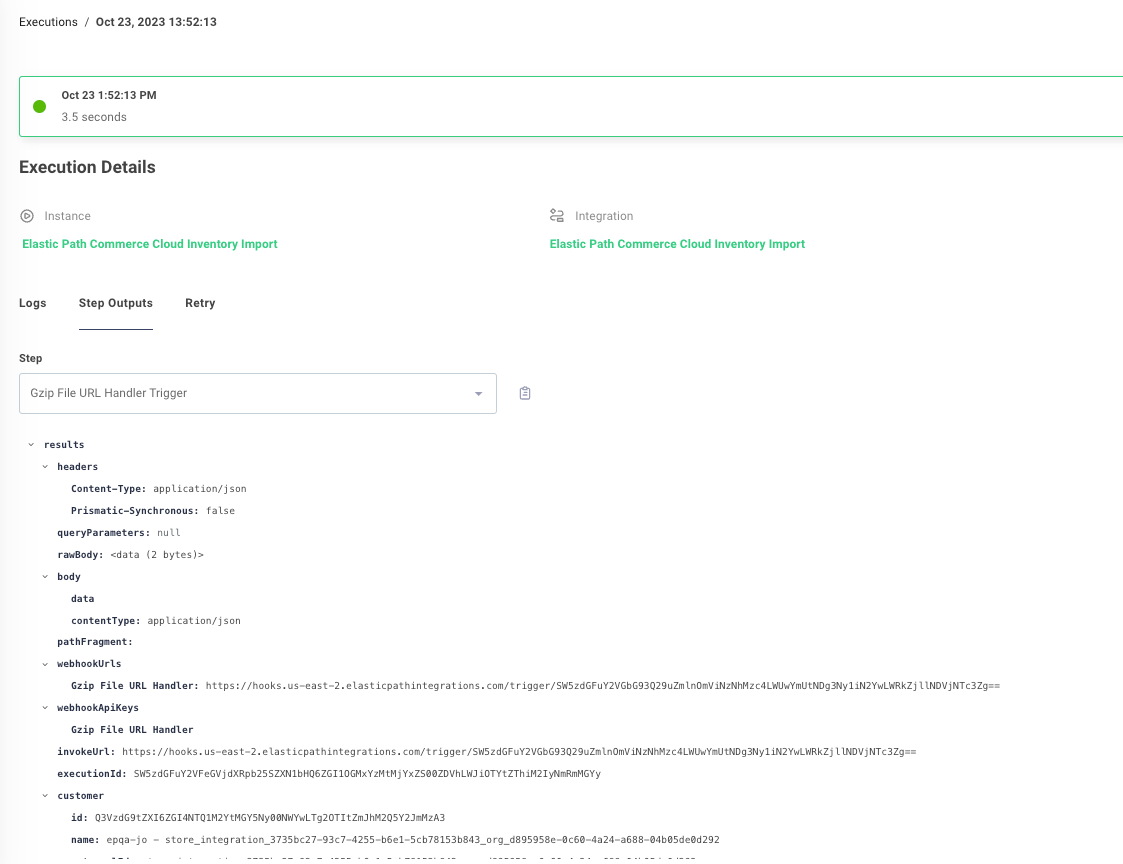
Select View in Execution Context to view the execution details. The type of information displayed includes:
- The trigger that created an event.
- Release data.
- Any files that caused errors.
Searching and Filtering Logs
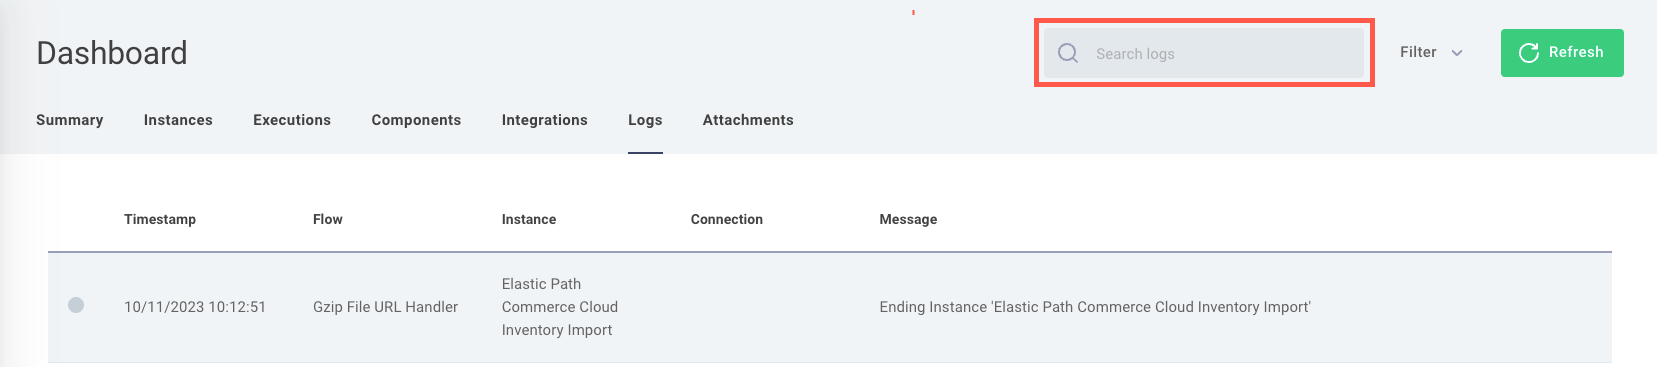
To search for specific messages in your logs, type part of the message into Search logs at the top of the page.
 mo
For more information on a specific log line, click the log line to view an additional information panel.
mo
For more information on a specific log line, click the log line to view an additional information panel.
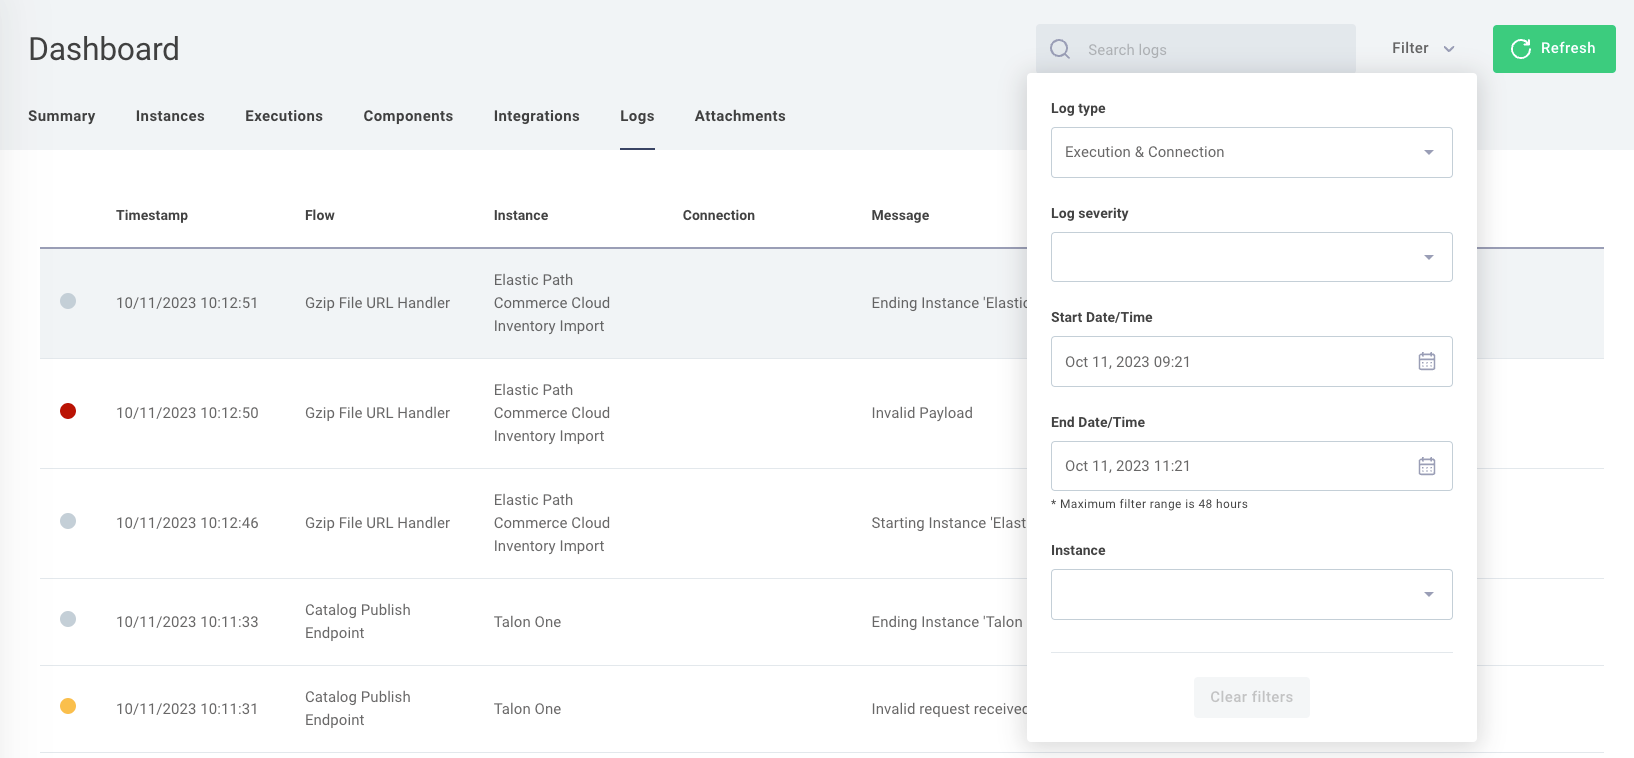
Additionally, you can apply filters to your logs. Click the Filter list to the right of the search bar and select any of the following options:
- Log Type - For example, apply the Connection Only filter if you are searching for authentication issues, such as when a connection fails to receive a token during an automatic refresh.
- Log Severity - Apply filters to find messages according to their severity level.
fatalErrorwarninfodebugtracemetric
- Timestamps - For example, use start date/time and end date/time to create a range to search within.
- Instance - Apply filters to find messages from specific parts of an integration.
Viewing Connection Logs
Connections that are used for testing in Builder, and those assigned to deployed instances, create logs. If a connection ever throws a connection error (for example, if the credentials in the connection have expired), you will see that in the connection's logs.
To view a connection's logs, click the log icon to the right of the connection.
What Gets Logged?
If a component invokes context.logger.{debug,info,warn,error}() within its code, the log line is saved in Monitor's logging system.
In addition to logs issuing from components, you will see the following types of log lines in your logs:
| Type | Example | Purpose | Log Level |
|---|---|---|---|
| Instance Start | Starting Instance 'Sample Instance' | Indicates when an instance begins to run. | info |
| Instance End | Ending Instance 'Sample Instance' | Indicates that an instance ran successfully to completion. | info |
| Step Started | Fetch file from Dropbox | Displays the name of the step that was invoked. | info |
| Step Failed | {{ERROR MESSAGE}} | Indicates that a step of an instance failed to run, and displays the related error message. | error |
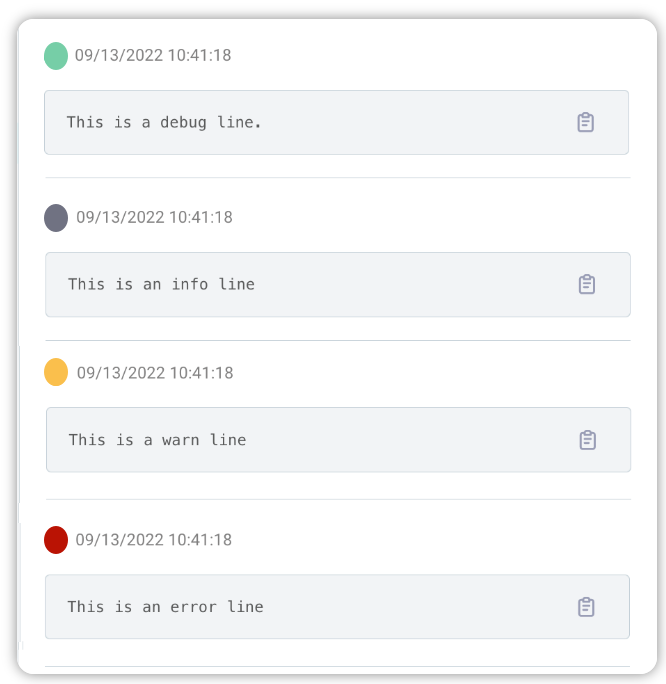
Log Levels
Monitor has the following log levels. Logs are presented with a colored dot to indicate their severity.